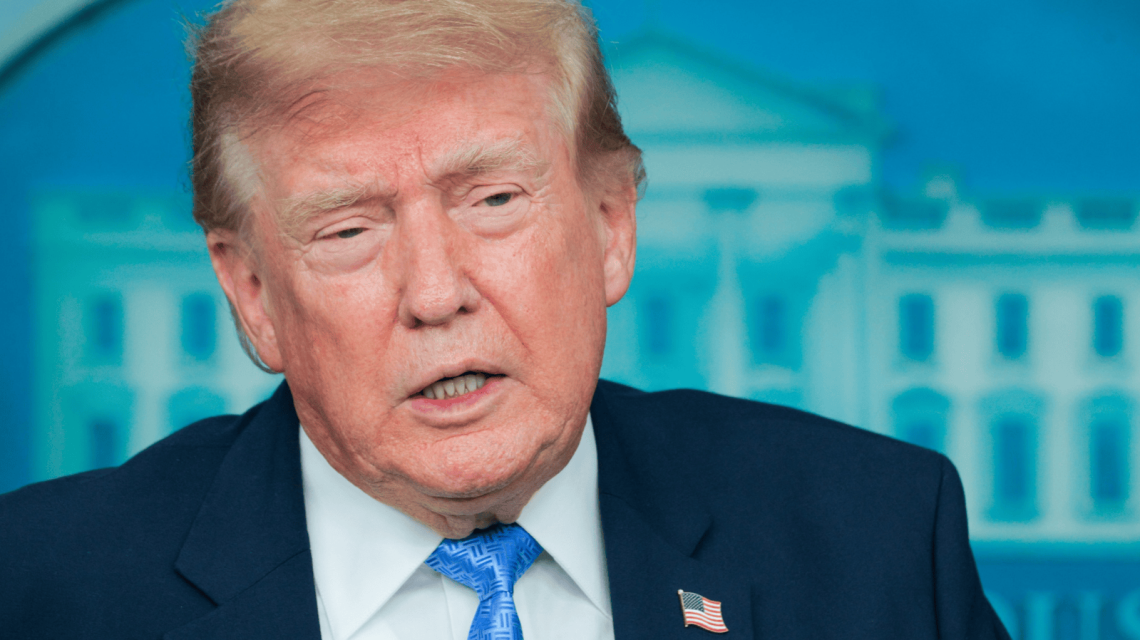
President Donald Trump’s approval ratings varied significantly among income groups according to recent Echelon Insights polls. Between September and November, his net approval improved by 26 points among voters earning less than $30,000, while it fell by 18 points among those making over $125,000. These changes followed midterm elections focused on economic concerns. Experts, however, warn that small sample sizes might render these results volatile.
Expert Opinions
Costas Panagopoulos, a professor at Northeastern University, highlighted the rarity of such shifts in public opinion. He suggested that the differences could stem from statistical noise due to limited subgroup sample sizes. David Barker from American University found the pattern fascinating, yet agreed it might simply be random noise.
The Trump administration defended the president’s policies, citing achievements in tax, border security, health care, employment, and trade. Davis Ingle, a spokesman, stated that Trump will continue delivering results for Americans.
Poll Findings
The September survey showed only 23% of respondents in households earning under $30,000 approved of Trump’s performance, resulting in a net approval of minus 52. Among those earning $125,000 or more, 41% approved, with a net rating of minus 17.
By October, approval among lower-income voters rose to 33%, with disapproval dropping to 65%. The wealthier group’s approval remained at 41%, while disapproval decreased slightly. November results showed further disparity, as approval among lower-income respondents reached 36%, yet Trump’s approval among the highest earners fell to 32%.
Panagopoulos noted that Trump remained underwater with both groups, as disapproval exceeded approval. These polls included around 1,000 participants each, carrying margins of error close to 3.6-3.7%.
Challenges in Surveying Income Groups
Thomas Gift from University College London discussed the challenges of surveying high- and low-income populations, who are often difficult to reach, leading to larger error margins. He suggested that if trends persist across numerous surveys, they could indicate meaningful changes.
Barker emphasized caution when analyzing different income brackets across surveys, noting difficulties in drawing firm conclusions without consistent data. He recommended longitudinal panel data to offer more definitive insights.
Possible Explanations for Shifts
If the pattern proves genuine, Panagopoulos attributed changes to Republican efforts targeting working-class families, while wealthier voters may have assessed Trump’s economic record more critically leading up to the elections. Barker cited campaign dynamics as a key factor, with political messaging reminding voters of their partisan identities.
Juven Jacob, a political strategist, pointed to Trump’s proposal for $5,000 checks as potentially appealing to lower-income voters. However, the impact of this promise would depend on awareness and expectations among respondents.
Gift cautioned against drawing connections between poll results and stock-market movements without explicit survey questions. Barker also saw this as plausible but lacked sufficient evidence.
Economic Experiences and Voter Opinions
Jacob noted that different economic realities influence voter opinions. For some households, the economy hinges on everyday expenses, while others consider investment concerns. Barker queried whether economic experiences alone explained approval changes among those earning under $30,000.
James Christopher, a Democratic consultant, expressed skepticism over short-lived market fluctuations influencing these voters, considering their focus on immediate affordability concerns.
Future Survey Implications
Panagopoulos suggested that further surveys would be needed to confirm the trends. Jacob recommended focusing on approval and disapproval separately, as shifts in support could indicate different phenomena. Barker emphasized the need for data continuity beyond campaign periods to assess partisan loyalty impacts.
Overall, the findings provide an intriguing snapshot rather than solid evidence of permanent political shifts among America’s income groups.
 Highlights from Recent News Stories
 Former Press Secretary Criticizes GOP’s Election Strategies
 Trump and Cornyn Clash Over Judicial Nomination
 Ted Cruz and James Talarico Discuss Texas Space Academy Proposal
 Newly Proposed Legislation Aims to Ease Family Travel
 Trump Open to Bipartisan Health Care Plan with Democrats