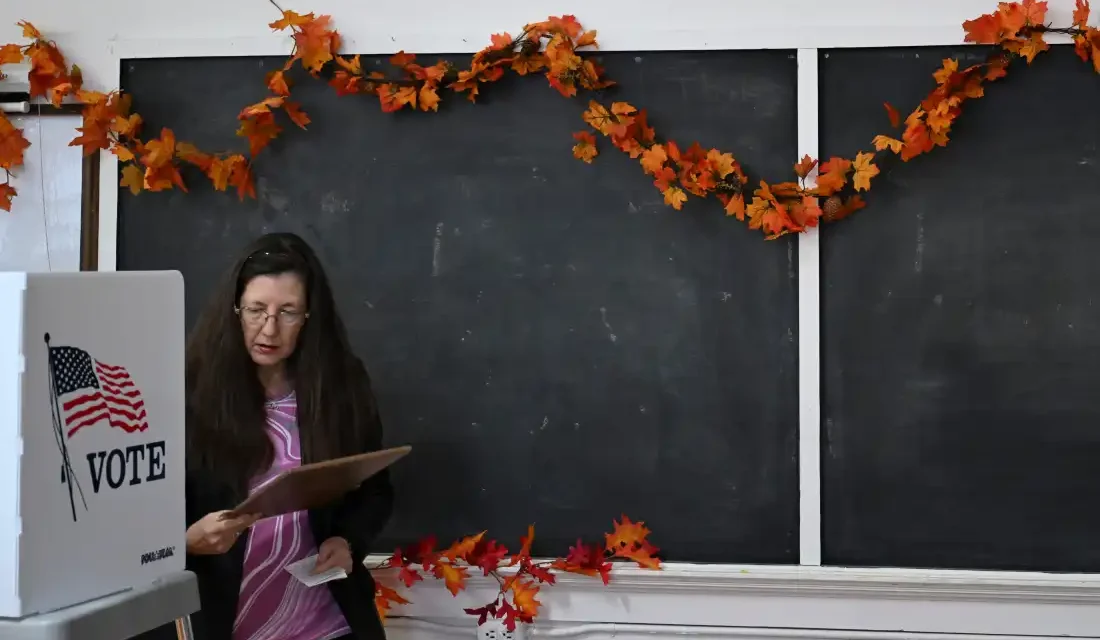
Bonnie Ford participated in the voting process at the De Borgia School in De Borgia, Montana, on Tuesday. This example highlights the involvement of citizens in midterm elections.
The charts below illustrate how different demographic groups made their choices during these elections. The data specifically shows the percentage of voters who cast their ballot for a House candidate from each political party.
The information reported is derived from a poll conducted by SSRS, surveying tens of thousands of voters. The poll results were gathered for several news organizations, including the Associated Press.
It’s important to note that the full sample from this poll has a margin of error of ±0.6 percentage points. This provides a comprehensive view of voting trends among various demographic sectors in these elections.
 Election Results and Insights
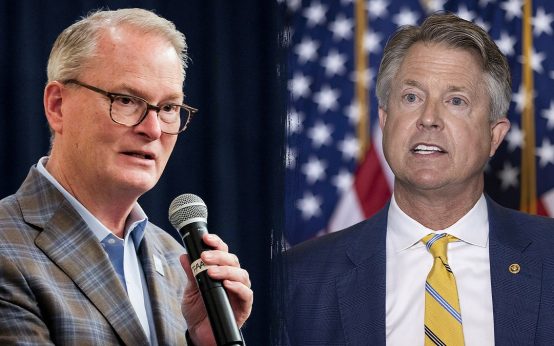 Historic Democratic Victory in Kansas Senate Race
 Election Coverage: Key Senate and Governor Races Shape U.S. Political Landscape
 Democratic Wins, Musk’s Reaction, and Election Night Insights
 Potential Shift in Israeli Government Amid Political Challenges
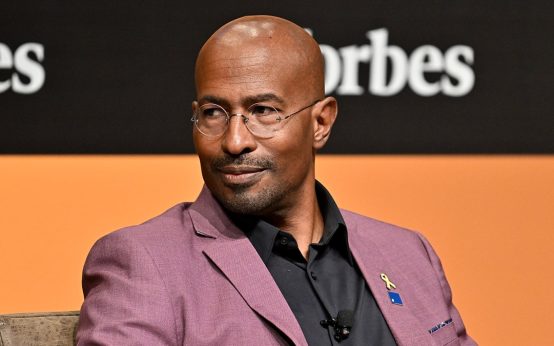 Van Jones Compares GOP Losses to Jonestown