
Governments ideally balance deficits during economic downturns with surpluses during prosperous times. In practice, the U.S. federal government has consistently run deficits. This has contributed to the national debt reaching nearly $40 trillion. To understand this, let’s revisit significant financial milestones starting from 1962.
1960s
In the 1960s, most federal spending was discretionary. Entitlement spending like Social Security was relatively minor.
In 1966, Medicare and Medicaid began paying benefits, marking a shift towards increased entitlement spending.
1970s
Between 1973 and 1975, a recession caused the deficit to spike.
1980s
During the 1980s, defense buildup and lower tax rates contributed to higher deficits. This period saw significant discretionary spending.
1990s
In 1992, defense spending decreased after the Cold War ended. By 1998, the government achieved a surplus due to strong economic growth, high revenue, and spending restraint.
Early 2000s
Around 2002, a recession, tax cuts, and expenses from wars initiated after the September 11 attacks led to renewed deficits.
Great Recession Era
From 2009 to 2011, the Great Recession caused deficits to soar.
Mid-2010s
In 2015, as the economy recovered and discretionary spending was controlled, the deficit dropped to a recent low.
2020s
The COVID-19 pandemic, along with emergency stimulus spending, resulted in record deficits in 2020.
By 2026, deficits remain elevated due to increasing entitlement obligations and interest payments. The debt is projected to reach 101 percent of GDP by 2026.
 Violence in Twin Cities Spurs Criticism from GOP Candidate
  Jack Smith’s Political Involvement and Controversial Actions
 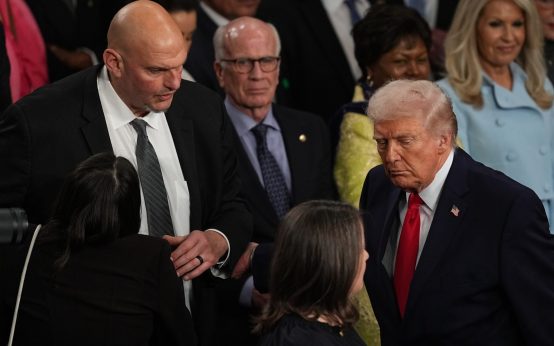 Trump’s Comments Spark Speculation About Senator Fetterman’s Political Future
  Trump Suggests Renaming Oceans and Rivers
  Contentious Race in Pennsylvania’s 10th District Heats Up
  DSA-Aligned Candidates: A New Trend in State Legislative Races